查询优化器
优化器是数据库系统的核心,优秀的优化器能极大提高查询性能,特别是在复杂查询场景下优化器能带来数倍至数百倍的性能提升。
ByConity 自研优化器基于三个优化方向提供极致优化能力:
- RBO:基于规则的优化能力。ByConity实现了两种方案,一种是基于Visitor的全局改写,例如Filter的下推、列裁剪等。另一种是pattern match的局部改写,例如把两个Filter进行merge等。总体支持了列裁剪、分区裁剪、表达式简化、子查询解关联、谓词下推、冗余算子消除、Outer-JOIN 转 INNER-JOIN、算子下推存储、分布式算子拆分等常见的启发式优化能力。
- CBO:基于代价的优化能力。这种优化依赖于统计信息的收集,目前是基于Cascades的一个搜索框架实现。ByConity支持了Join Reorder、Outer-Join Reorder、Join/Agg Reorder、CTE、物化视图、Dynamic Filter 下推、Magic Set 等基于代价的优化能力。并且面向分布式计划融合了 Property Enforcement。
- DBO:基于数据依赖的优化能力。支持:唯一键、functional dependency、Order dependency、Inclusion dependency 等基于数据依赖关系的优化能力。
在ByConity中可以使用以下参数打开优化器:
-- 注意:这里如果打开了ANSI mode, 优化器也会自动打开
set dialect_type ='ANSI'
-- 或者
set enable_optimizer =1
收集、显示和删除统计信息的命令
###语法定义:
- 说明:后续版本将具有自动收集、更新和分析统计信息的功能
-- NOTE: 参数ALL表示当前数据库的所有表

-- 支持指定列和样本配置
CREATE STATS [IF NOT EXISTS] (<db>.* | ALL | [<db>.]<table>['(' <col1>, <col2>, ..., <coln> ')']) [WITH (FULLSCAN | SAMPLE [<rows> ROWS] [<ratio> RATIO])]

-- 删除统计信息
-- 支持指定列
DROP STATS (<db>.* | ALL | [<db>.]<table>['(' <col1>, <col2>, ..., <coln> ')' ])

-- 支持指定列
SHOW (STATS|COLUMN_STATS) (<db>.* | ALL | [<db>.]<table>'('<col1>, <col2>, ..., <coln> ')' )
收集统计信息
-- 为当前数据库中没有统计信息的所有表创建统计信息
create stats if not exists all;

-- 为db1中没有统计信息的所有表创建统计信息
create stats if not exists db1.*;

-- 为t1.c1创建统计信息
create stats t1(c1);

-- 为t1.c1,和t1.c2创建统计信息
create stats t1(c1, c2);

-- 在t1上创建统计信息,强制使用全表扫描,
create stats t1 with fullscan

-- 在创建每个表的统计信息时候,抽样如下行
-- MAX(**statistics_sample_row_count**, 0.01 * full_rows_count)
create stats all with 0.01 ratio;

-- 在创建每个表的统计信息时,抽样如下行
-- MAX(40000000, 0.01 * full_rows_count)
create stats all with 0.01 ratio 40000000 rows;

-- 使用默认设置进行取样,
-- 由 statistics_sample_row_count 和 statistics_sample_ratio 控制
create stats all with sample;
显示统计信息
-- 显示当前数据库中所有表的表统计信息
show stats all;

-- 显示 db1 中所有表的表统计信息
show stats db1.*;

-- 显示表 t1 的表统计信息
show stats t1;

-- 显示表 t1 的列统计信息
show column_stats t1;

-- 显示表 t1 的列 c1、c2 的列统计信息
show column_stats t1(c1, c2);
删除统计信息
-- 删除当前数据库中所有表的统计信息
drop stats all;

-- 删除 db1.* 中所有表的统计信息
drop stats db1.*;

-- 删除表 t1 的统计信息
drop stats t1;

-- 删除表 t1 的列 c1、c2 的统计信息
drop stats t1(c1, c2);
Explain的使用
- Explain + SQL
EXPLAIN
WITH
    (
        SELECT
            sr_customer_sk AS ctr_customer_sk,
            sr_store_sk AS ctr_store_sk,
            sum(sr_return_amt) AS ctr_total_return
        FROM store_returns
        , date_dim
        WHERE (sr_returned_date_sk = d_date_sk) AND (d_year = 2000)
        GROUP BY
            sr_customer_sk,
            sr_store_sk
    ) AS customer_total_return
SELECT c_customer_id
FROM customer_total_return AS ctr1
, store
, customer
WHERE (ctr1.ctr_total_return >
(
    SELECT avg(ctr_total_return) * 1.2
    FROM customer_total_return AS ctr2
    WHERE ctr1.ctr_store_sk = ctr2.ctr_store_sk
)) AND (s_store_sk = ctr1.ctr_store_sk) AND (s_state = 'TN') AND (ctr1.ctr_customer_sk = c_customer_sk)
ORDER BY c_customer_id ASC
LIMIT 100
结果输出:

- Explain analyze + SQL
EXPLAIN ANALYZE LOGICAL
WITH customer_total_return AS

    (
        SELECT
            sr_customer_sk AS ctr_customer_sk,
            sr_store_sk AS ctr_store_sk,
            sum(sr_return_amt) AS ctr_total_return
        FROM store_returns
        , date_dim
        WHERE (sr_returned_date_sk = d_date_sk) AND (d_year = 2000)
        GROUP BY
            sr_customer_sk,
            sr_store_sk
    )
SELECT c_customer_id
FROM customer_total_return AS ctr1
, store
, customer
WHERE (ctr1.ctr_total_return >
(
    SELECT avg(ctr_total_return) * 1.2
    FROM customer_total_return AS ctr2
    WHERE ctr1.ctr_store_sk = ctr2.ctr_store_sk
)) AND (s_store_sk = ctr1.ctr_store_sk) AND (s_state = 'TN') AND (ctr1.ctr_customer_sk = c_customer_sk)
ORDER BY c_customer_id ASC
LIMIT 100
┌─Explain Analyze──────────────────────────────────────────────────────────────────────────────────────────────────────────────────────────────────────────────────────┐
│ Limit │
│ │ Est. 100 rows, cost 8.2e+05 │
│ │ Act. 100 rows (2.4 KB), Throughput: 545.0K rows/s, CPU Time per worker: avg 2.0 us, max 2.0 us, Wall Time: 1.8 ms │
│ │ Filtered: 0.0%, QError: 1.0 │
│ └─ MergeSorting │
│ │ Est. 49.2K rows, cost 8.2e+05 │
│ │ Act. 100 rows (2.4 KB), Throughput: 545.0K rows/s, CPU Time per worker: avg 2.0 us, max 2.0 us, Wall Time: 1.8 ms │
│ │ Filtered: 96.9%, QError: 504.1 │
│ └─ Union │
│ │ Est. 49.2K rows, cost 8.2e+05 │
│ │ Act. 3.1K rows (78.1 KB), Throughput: 17.0M rows/s, CPU Time per worker: avg 0.0 us, max 0.0 us, Wall Time: 1.8 ms │
│ │ Filtered: 0.0%, QError: 15.8 │
│ └─ PartialSorting │
│ │ Est. 49.2K rows, cost 8.2e+05 │
│ │ Act. 3.1K rows (78.1 KB), Throughput: 17.0M rows/s, CPU Time per worker: avg 40.0 us, max 40.0 us, Wall Time: 1.8 ms │
│ │ Filtered: 0.0%, QError: 15.8 │
│ └─ Gather Exchange │
│ │ Est. 49.2K rows, cost 8.2e+05 │
│ └─ MergeSorting │
│ │ Est. 49.2K rows, cost 8.1e+05 │
│ │ Act. 12.5K rows (313.1 KB), Throughput: 108.2M rows/s, CPU Time per worker: avg 23.0 us, max 25.0 us, Wall Time: 1.2 ms │
│ │ Filtered: -1.6%, QError: 3.9 │
│ └─ PartialSorting │
│ │ Est. 49.2K rows, cost 8.1e+05 │
│ │ Act. 12.3K rows (308.3 KB), Throughput: 91.6M rows/s, CPU Time per worker: avg 40.0 us, max 40.0 us, Wall Time: 1.3 ms │
│ │ Filtered: 0.0%, QError: 4.0 │
│ └─ Inner Join │
│ │ Est. 47.5K rows, cost 8.1e+05 │
│ │ Act. 12.3K rows (308.3 KB), Throughput: 91.6M rows/s, CPU Time per worker: avg 41.6 ms, max 41.8 ms, Wall Time: 1.3 ms │
│ │ Filtered: 0.0%, QError: 3.9 │
│ │ Condition: sr_store_sk_1 == s_store_sk │
│ │ Filter: `sum(sr_return_amt)_1` > (`avg(ctr_total_return)` * 1.2) │
│ ├─ Local Exchange │
│ │ │ Est. 49.2K rows, cost 2.9e+05 │
│ │ └─ Inner Join │
│ │ │ Est. 49.2K rows, cost 2.9e+05 │
│ │ │ Act. 49.3K rows (2.1 MB), Throughput: 542.3M rows/s, CPU Time per worker: avg 6.2 ms, max 6.4 ms, Wall Time: 896.0 us │
│ │ │ Filtered: 0.0%, QError: 1.0 │
│ │ │ Condition: c_customer_sk == sr_customer_sk_1 │
│ │ ├─ Repartition Exchange │
│ │ │ │ Est. 97.7K rows, cost 9.0e+04 │
│ │ │ │ Partition by: {c_customer_sk} │
│ │ │ └─ ReadFromStorage tpcds.customer │
│ │ │ Est. 97.7K rows, cost 7.4e+04 │
│ │ │ Act. 97.7K rows (3.1 MB), Throughput: 22.2G rows/s, CPU Time per worker: avg 362.0 us, max 402.0 us, Wall Time: 47.0 us │
│ │ │ Filtered: 0.0%, QError: 1.0 │
│ │ └─ Repartition Exchange │
│ │ │ Est. 50.9K rows, cost 6.1e+04 │
│ │ │ Partition by: {sr_customer_sk_1} │
│ │ └─ CTERef [0] │
│ │ Est. 50.9K rows, cost 5.2e+04 │
│ └─ Broadcast Exchange │
│ │ Est. 7 rows, cost 5.6e+04 │
│ └─ Inner Join │
│ │ Est. 7 rows, cost 5.6e+04 │
│ │ Act. 6 rows (102.0 Bytes), Throughput: 67.7K rows/s, CPU Time per worker: avg 280.0 us, max 360.0 us, Wall Time: 870.0 us │
│ │ Filtered: 97.9%, QError: 1.2 │
│ │ Condition: s_store_sk == sr_store_sk_2 │
│ ├─ Repartition Exchange │
│ │ │ Est. 12 rows, cost 1.2e+01 │
│ │ │ Partition by: {s_store_sk} │
│ │ └─ Filter │
│ │ │ Est. 12 rows, cost 9.8e+00 │
│ │ │ Act. 12 rows (240.0 Bytes), Throughput: 28.6M rows/s, CPU Time per worker: avg 16.0 us, max 24.0 us, Wall Time: 5.0 us │
│ │ │ Filtered: 0.0%, QError: 1.0 │
│ │ │ s_state = 'TN' │
│ │ └─ ReadFromStorage tpcds.store │
│ │ Est. 12 rows, cost 8.9e+00 │
│ │ Act. 12 rows (240.0 Bytes), Throughput: 28.6M rows/s, CPU Time per worker: avg 48.0 us, max 72.0 us, Wall Time: 4.0 us │
│ │ Filtered: 0.0%, QError: 1.0 │
│ └─ MergingAggregated │
│ │ Est. 6 rows, cost 5.6e+04 │
│ │ Act. 280 rows (4.9 KB), Throughput: 3.1M rows/s, CPU Time per worker: avg 60.0 us, max 80.0 us, Wall Time: 867.0 us │
│ │ Filtered: 0.0%, QError: 46.7 │
│ └─ Repartition Exchange │
│ │ Est. 6 rows, cost 5.6e+04 │
│ │ Partition by: {sr_store_sk_2} │
│ └─ Aggregating │
│ │ Est. 6 rows, cost 5.6e+04 │
│ │ Act. 14 rows (238.0 Bytes), Throughput: 145.6K rows/s, CPU Time per worker: avg 7.0 us, max 9.0 us, Wall Time: 955.0 us │
│ │ Filtered: 100.0%, QError: 2.3 │
│ │ Group by: {sr_store_sk_2} │
│ └─ Projection │
│ │ Est. 50.9K rows, cost 5.6e+04 │
│ │ Act. 49.3K rows (887.4 KB), Throughput: 519.5M rows/s, CPU Time per worker: avg 0.0 us, max 0.0 us, Wall Time: 947.0 us │
│ │ Filtered: 0.0%, QError: 1.0 │
│ └─ CTERef [0] │
│ Est. 50.9K rows, cost 5.2e+04 │
│ CTEDef [0] │
│ MergingAggregated │
│ │ Est. 50.9K rows, cost 4.3e+05 │
│ │ Act. 49.3K rows (1.3 MB), Throughput: 497.5M rows/s, CPU Time per worker: avg 34.0 us, max 35.0 us, Wall Time: 996.0 us │
│ │ Filtered: 0.0%, QError: 1.0 │
│ └─ Repartition Exchange │
│ │ Est. 50.9K rows, cost 4.3e+05 │
│ │ Partition by: {sr_customer_sk, sr_store_sk} │
│ └─ Aggregating │
│ │ Est. 50.9K rows, cost 4.2e+05 │
│ │ Act. 51.4K rows (1.3 MB), Throughput: 1.1G rows/s, CPU Time per worker: avg 27.0 us, max 28.0 us, Wall Time: 506.0 us │
│ │ Filtered: 5.8%, QError: 1.0 │
│ │ Group by: {sr_customer_sk, sr_store_sk} │
│ └─ Inner Join │
│ │ Est. 50.9K rows, cost 4.2e+05 │
│ │ Act. 54.5K rows (1.4 MB), Throughput: 1.2G rows/s, CPU Time per worker: avg 14.3 ms, max 15.0 ms, Wall Time: 477.0 us │
│ │ Filtered: -90.6%, QError: 1.1 │
│ │ Condition: sr_returned_date_sk == d_date_sk │
│ ├─ Local Exchange │
│ │ │ Est. 280.8K rows, cost 2.3e+05 │
│ │ └─ Filter │
│ │ │ Est. 280.8K rows, cost 2.3e+05 │
│ │ │ Act. 54.5K rows (1.9 MB), Throughput: 5.7G rows/s, CPU Time per worker: avg 865.0 us, max 885.0 us, Wall Time: 96.0 us │
│ │ │ Filtered: 0.0%, QError: 5.2 │
│ │ │ Dynamic Filters: {sr_returned_date_sk:range} │
│ │ └─ ReadFromStorage tpcds.store_returns │
│ │ Est. 280.8K rows, cost 2.1e+05 │
│ │ Act. 54.5K rows (1.9 MB), Throughput: 5.8G rows/s, CPU Time per worker: avg 2.4 ms, max 2.4 ms, Wall Time: 95.0 us │
│ │ Filtered: 0.0%, QError: 5.2 │
│ └─ Projection │
│ │ Est. 366 rows, cost 6.0e+04 │
│ │ Act. 28.6K rows (228.8 KB), Throughput: 45.4G rows/s, CPU Time per worker: avg 1.1 ms, max 1.3 ms, Wall Time: 7.0 us │
│ │ Filtered: 0.0%, QError: 80.0 │
│ │ Dynamic Filters Builder: {d_date_sk} │
│ └─ Broadcast Exchange │
│ │ Est. 366 rows, cost 6.0e+04 │
│ └─ Filter │
│ │ Est. 366 rows, cost 5.9e+04 │
│ │ Act. 366 rows (6.1 KB), Throughput: 85.1M rows/s, CPU Time per worker: avg 282.0 us, max 283.0 us, Wall Time: 44.0 us │
│ │ Filtered: 0.0%, QError: 1.0 │
│ │ d_year = 2000 │
│ └─ ReadFromStorage tpcds.date_dim │
│ Est. 71.3K rows, cost 5.4e+04 │
│ Act. 366 rows (6.1 KB), Throughput: 85.1M rows/s, CPU Time per worker: avg 780.0 us, max 840.0 us, Wall Time: 43.0 us │
│ Filtered: 0.0%, QError: 199.6 │
│ note: Dynamic Filter is applied for 1 times. │
│ note: CTE(Common Table Expression) is applied for 2 times. │
└──────────────────────────────────────────────────────────────────────────────────────────────────────────────────────────────────────────────────────────────────────┘
- Explain analyze distributed + SQL
EXPLAIN ANALYZE DISTRIBUTED
SELECT
    i_item_id,
    avg(ss_quantity) AS agg1,
    avg(ss_list_price) AS agg2,
    avg(ss_coupon_amt) AS agg3,
    avg(ss_sales_price) AS agg4
FROM store_sales
, customer_demographics
, date_dim
, item
, promotion
WHERE (ss_sold_date_sk = d_date_sk) AND (ss_item_sk = i_item_sk) AND (ss_cdemo_sk = cd_demo_sk) AND (ss_promo_sk = p_promo_sk) AND (cd_gender = 'M') AND (cd_marital_status = 'S') AND (cd_education_status = 'College') AND ((p_channel_email
 = 'N') OR (p_channel_event = 'N')) AND (d_year = 2000)
GROUP BY i_item_id
ORDER BY i_item_id ASC
LIMIT 100
结果输出:
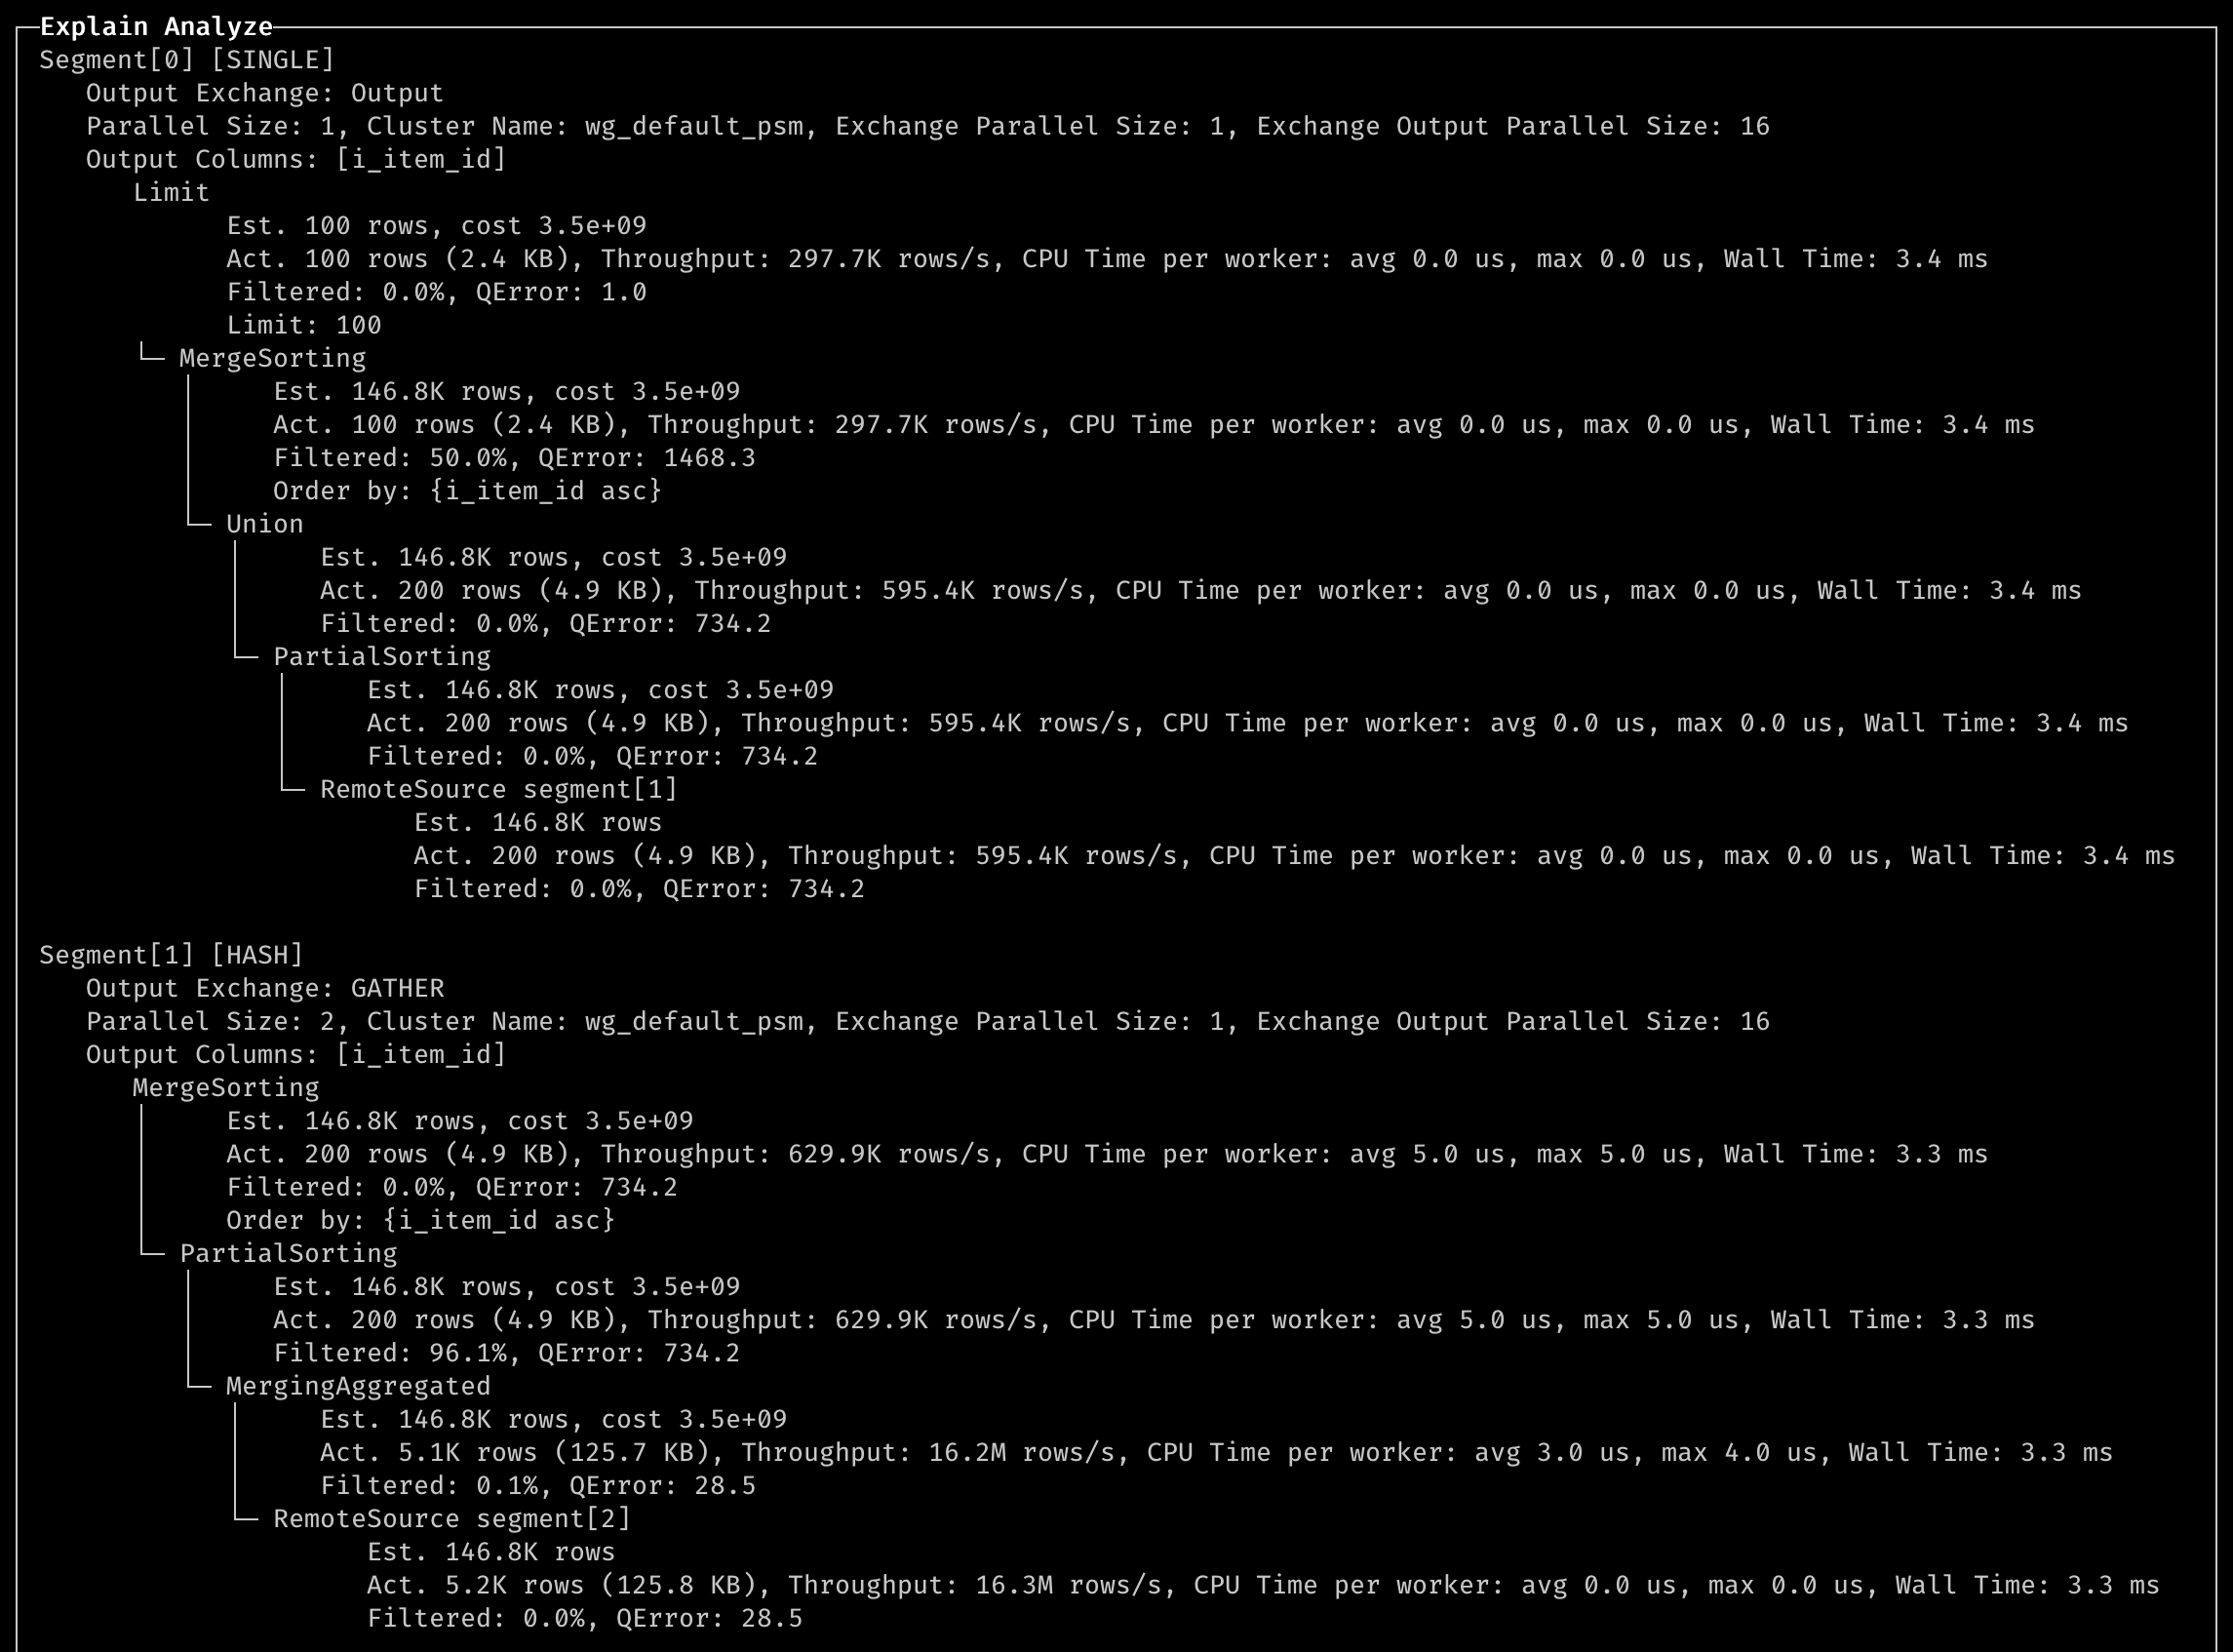
说明:
- QError: max(Est rows, Act rows) / min(Est rows, Act rows),1 是最佳的。
- Wall Time: 所有工作节点中的最大墙钟时间。我们可以找出哪个步骤花费了最多的时间。
- CPU Time: 我们可以找出哪个步骤存在数据倾斜问题(如果最大时间大于平均时间,则表示有一个工作节点处理了过多的数据)。