Data Visualization
Tutorial Objectives:
This document is designed to guide users in connecting and utilizing Byconity through common open-source and commercial data visualization tools.
Prerequisites:
Users need to acquire the HOST and PORT (TCP/HTTP) information for the Byconity service.
Currently Supported Tools
The currently supported visualization tools include:
Connection Methods:
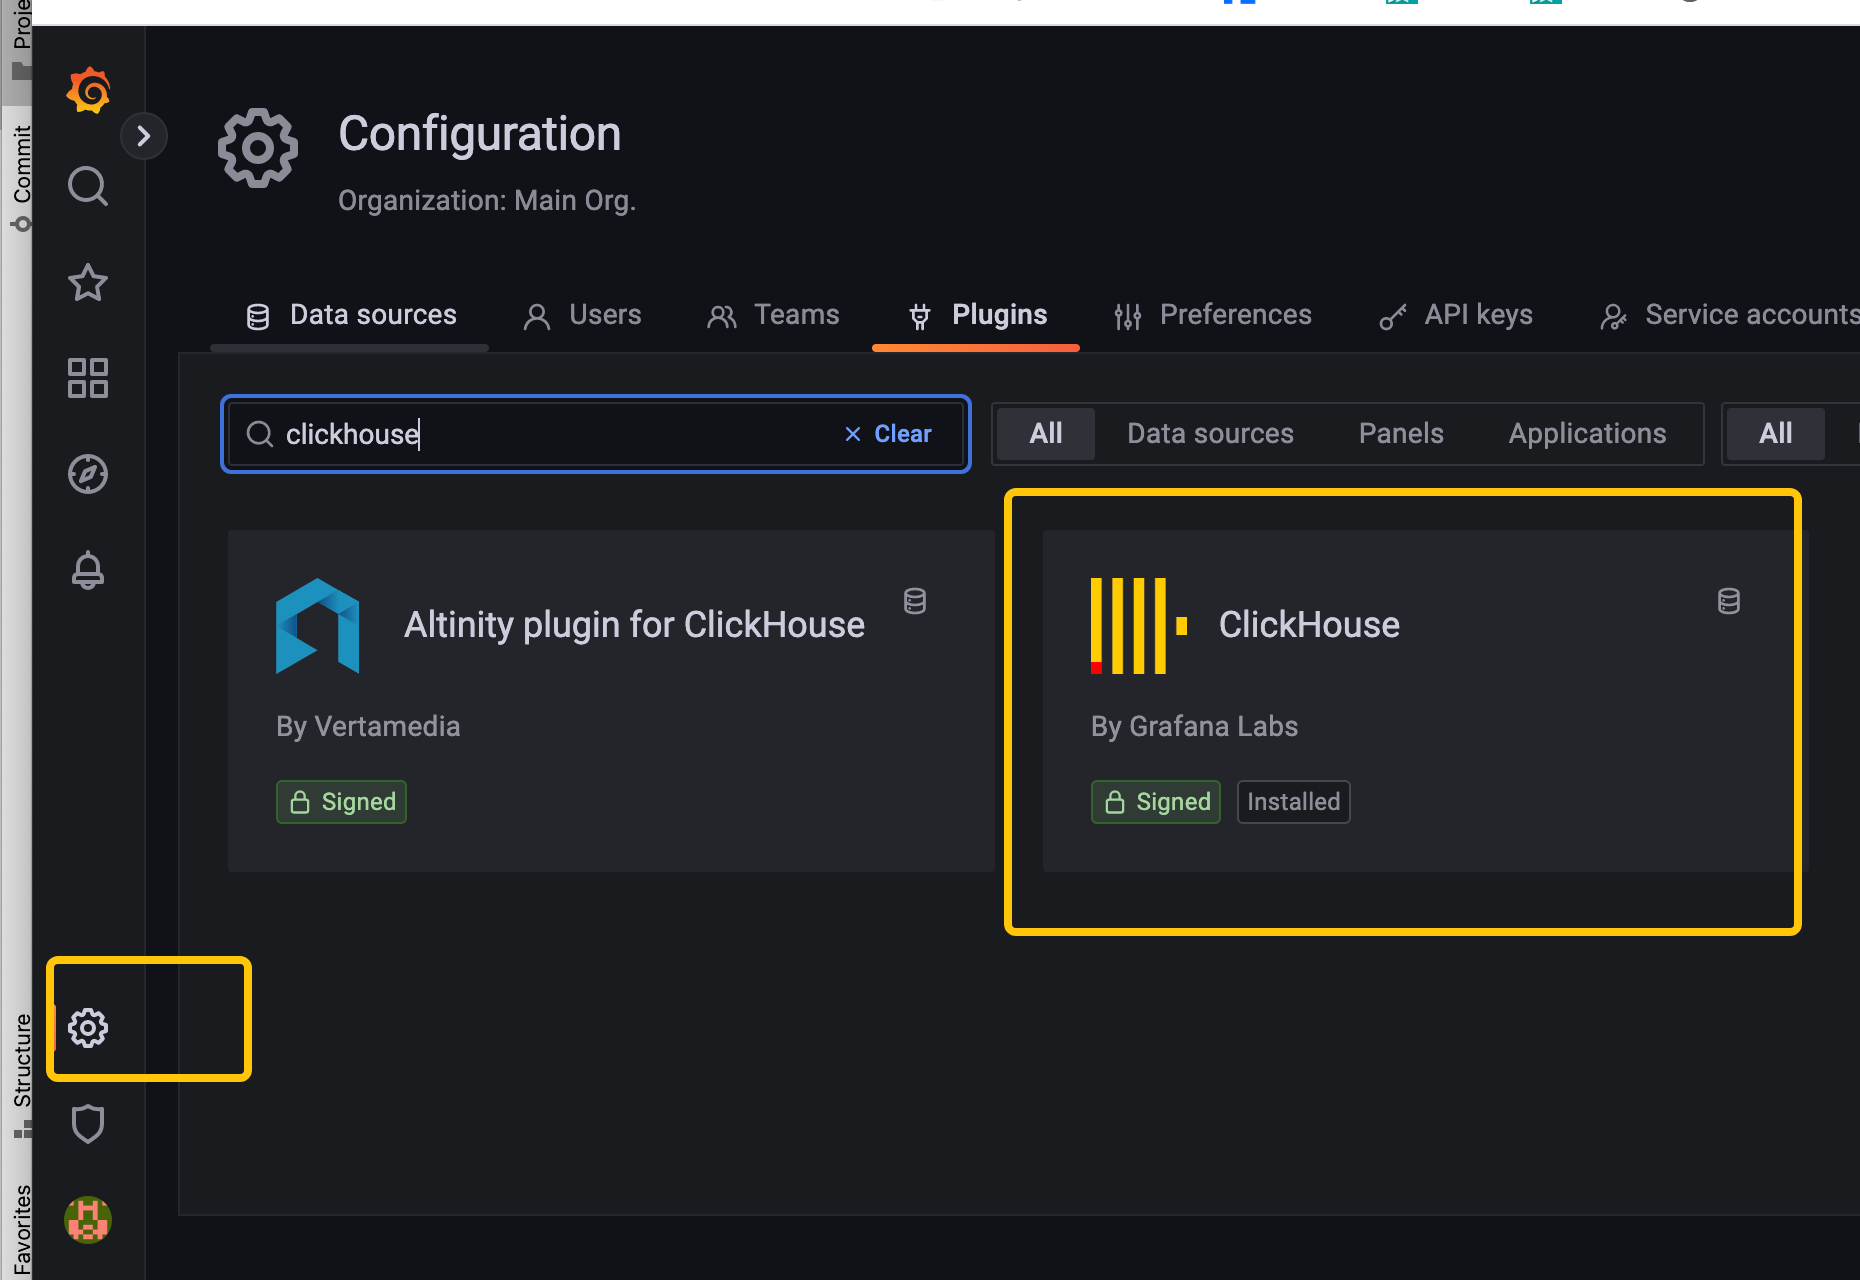
Grafana
The connection method is the same as connecting to an open-source ClickHouse. Refer to:
Connection method: https://clickhouse.com/docs/en/connect-a-ui/grafana-and-clickhouse
Grafana installation method: https://grafana.com/docs/grafana/v9.0/setup-grafana/installation/

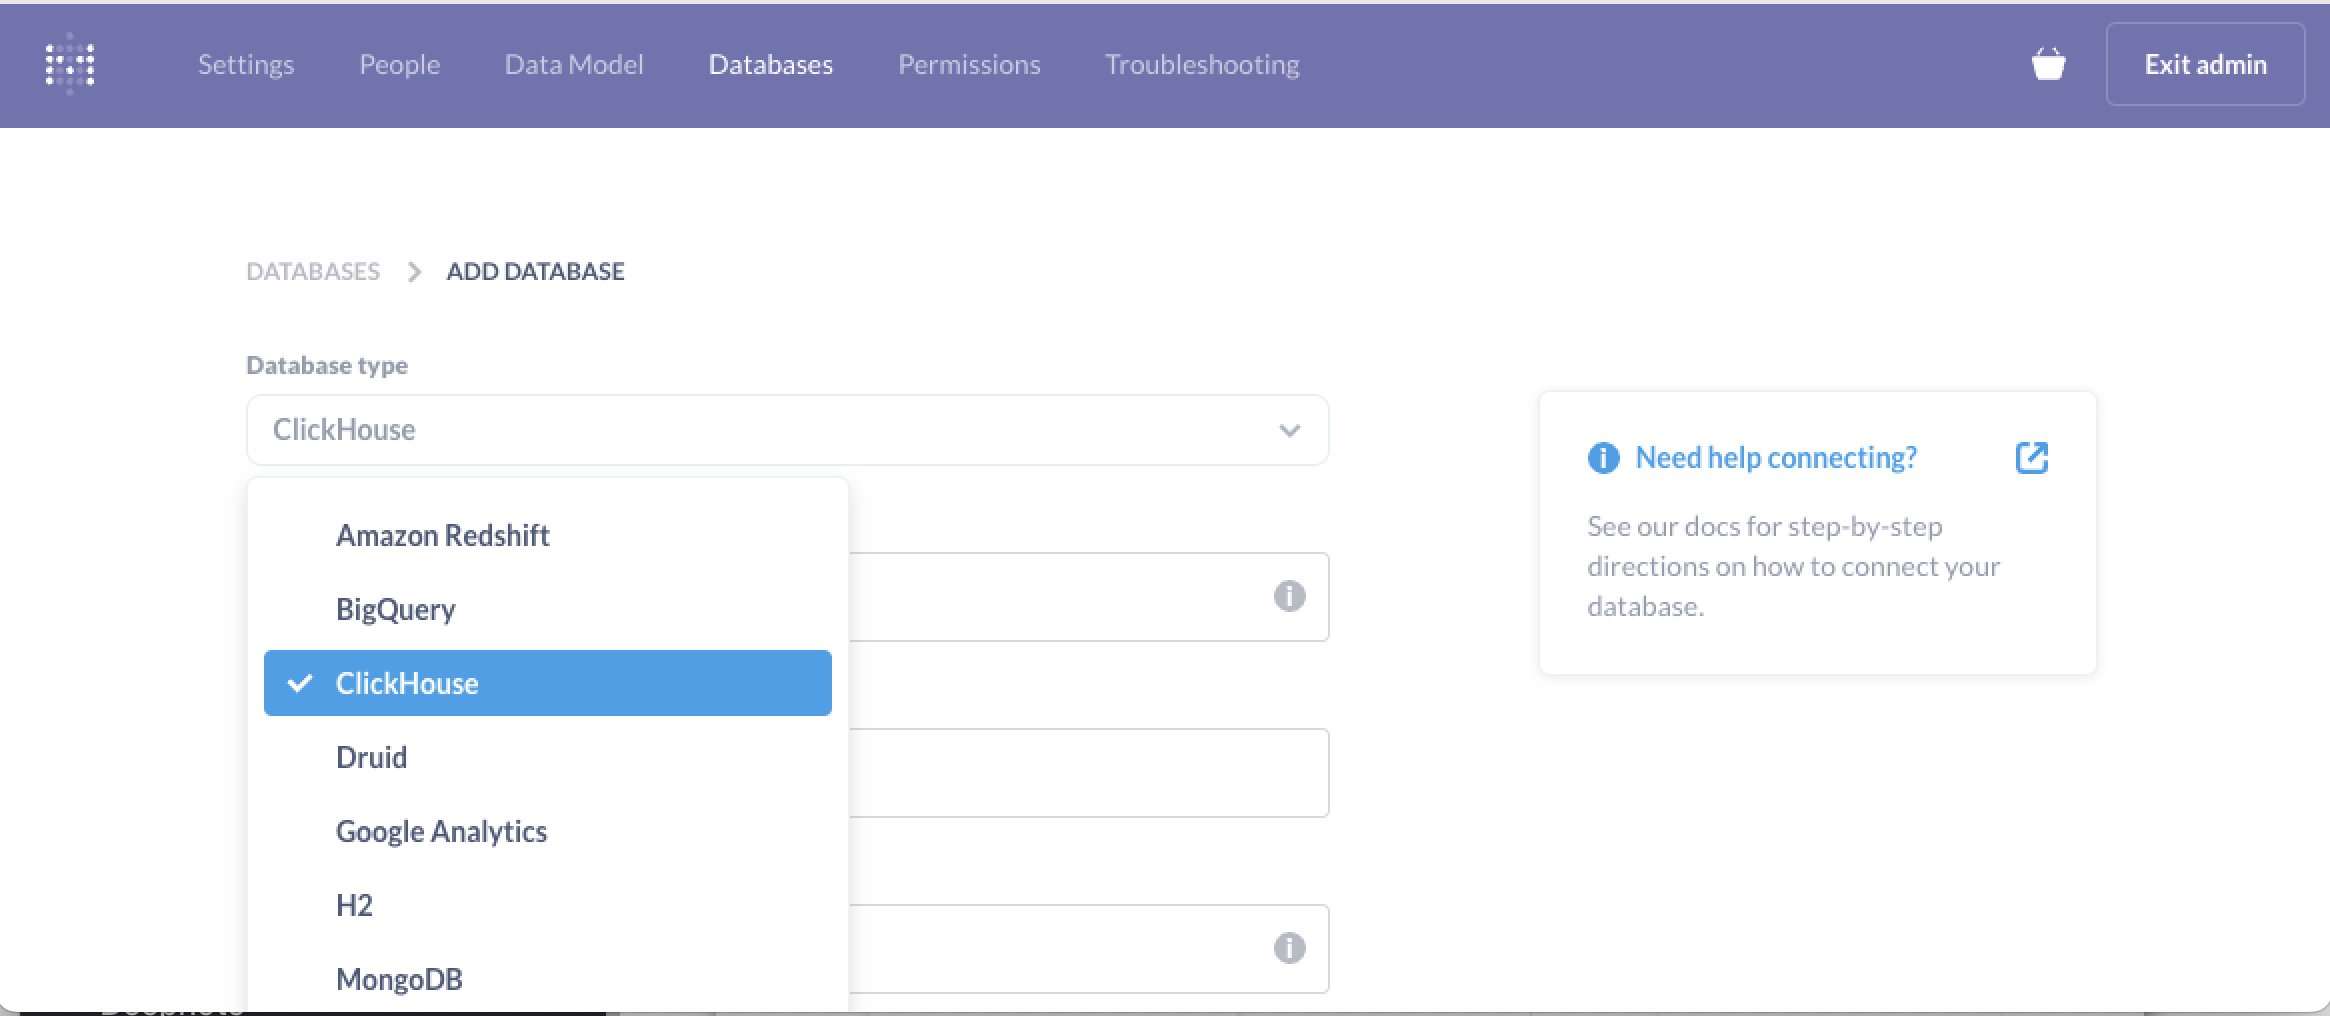
Metabase
The connection method is the same as connecting to an open-source ClickHouse. Refer to:
https://clickhouse.com/docs/en/connect-a-ui/metabase-and-clickhouse
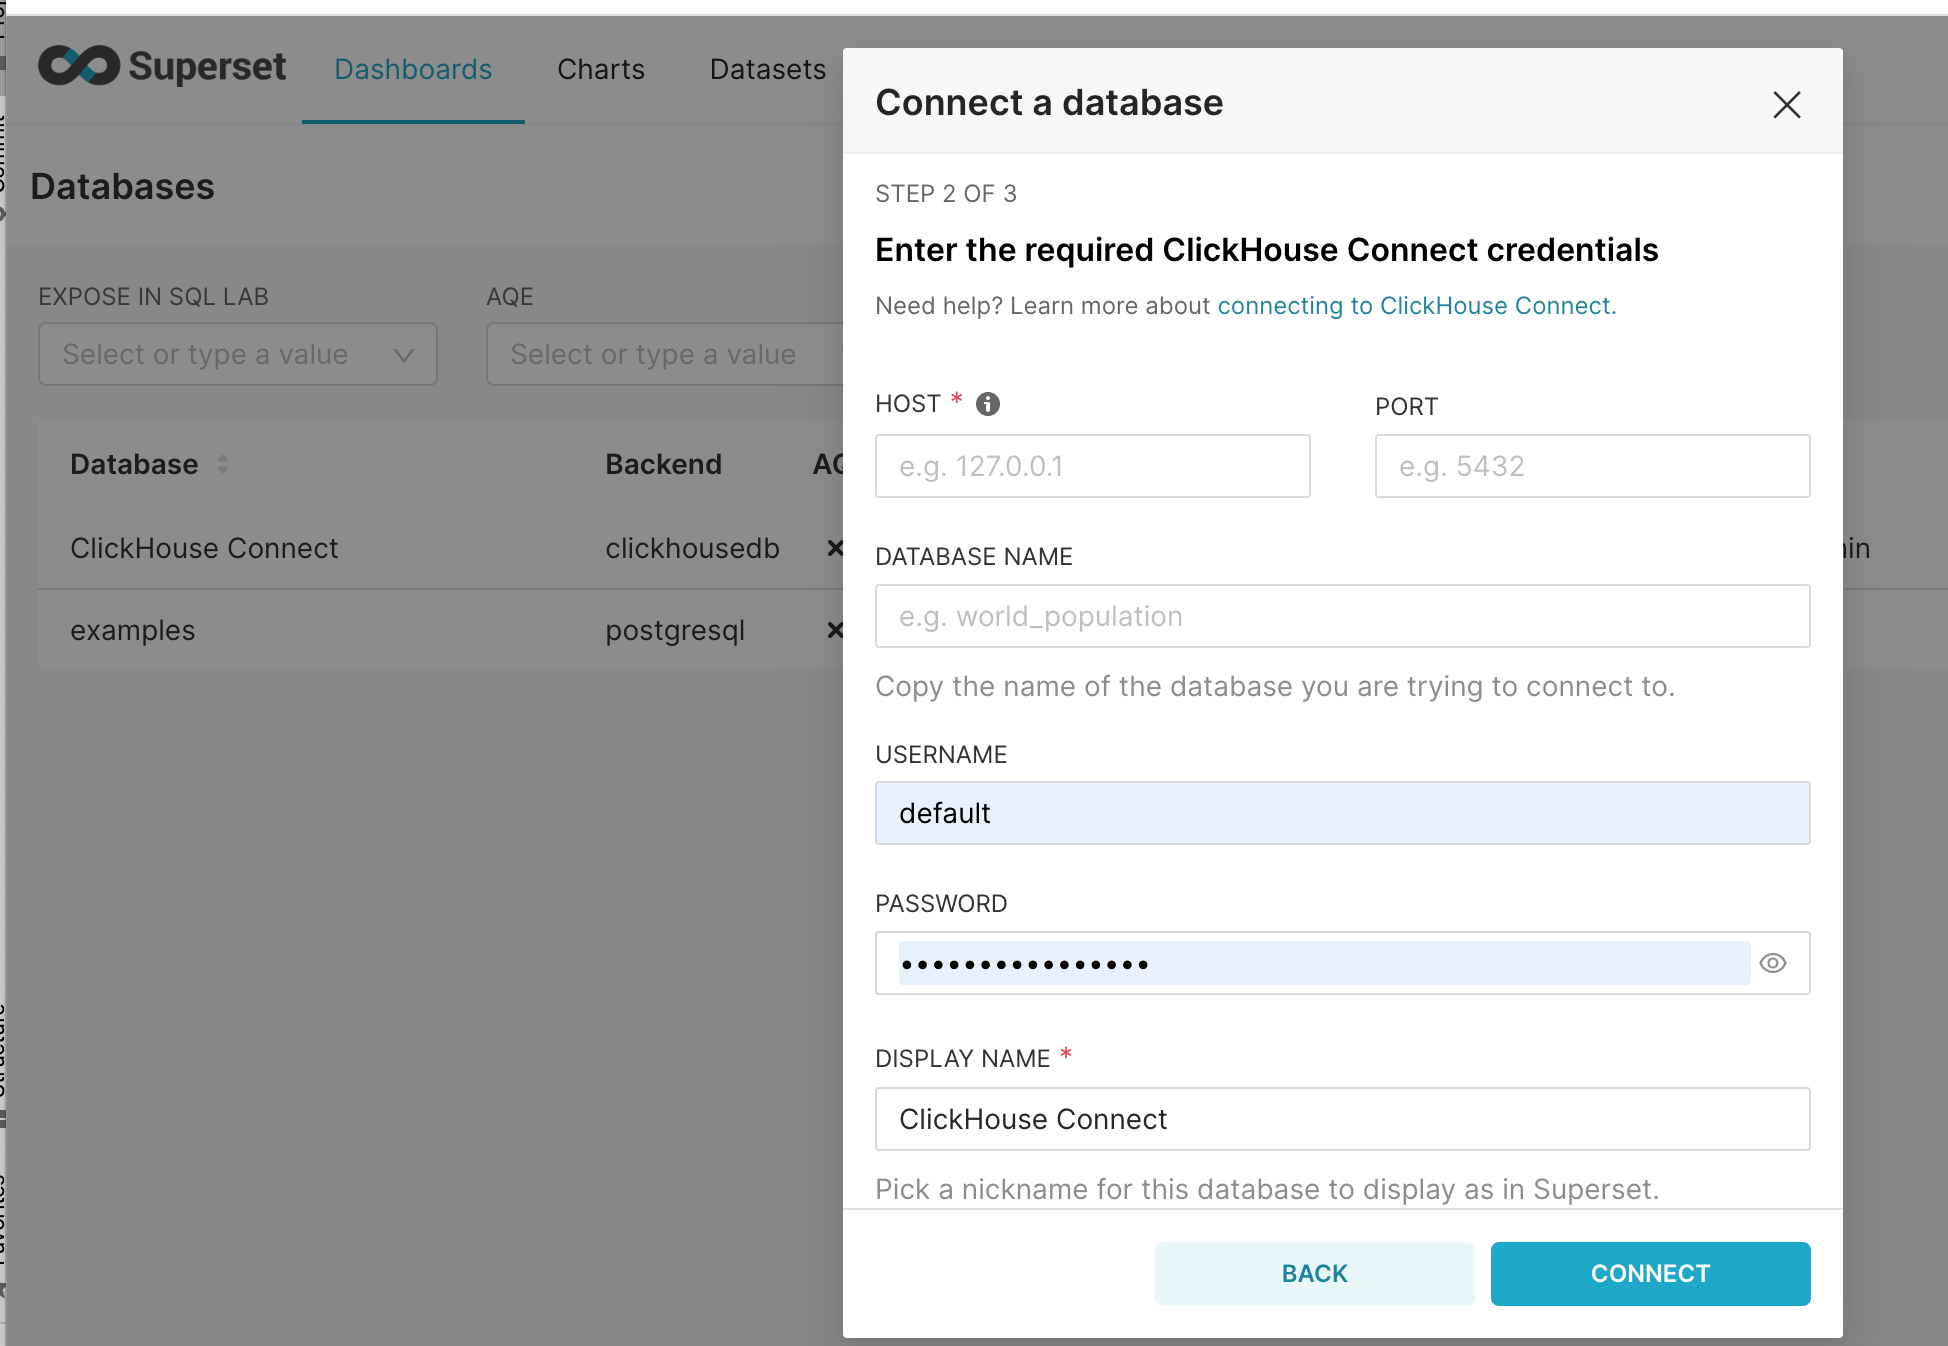
SuperSet:
The connection method is the same as connecting to an open-source ClickHouse. Refer to:
Connection method: https://clickhouse.com/docs/en/connect-a-ui/superset-and-clickhouse
SuperSet installation method: https://superset.apache.org/docs/installation/installing-superset-using-docker-compose

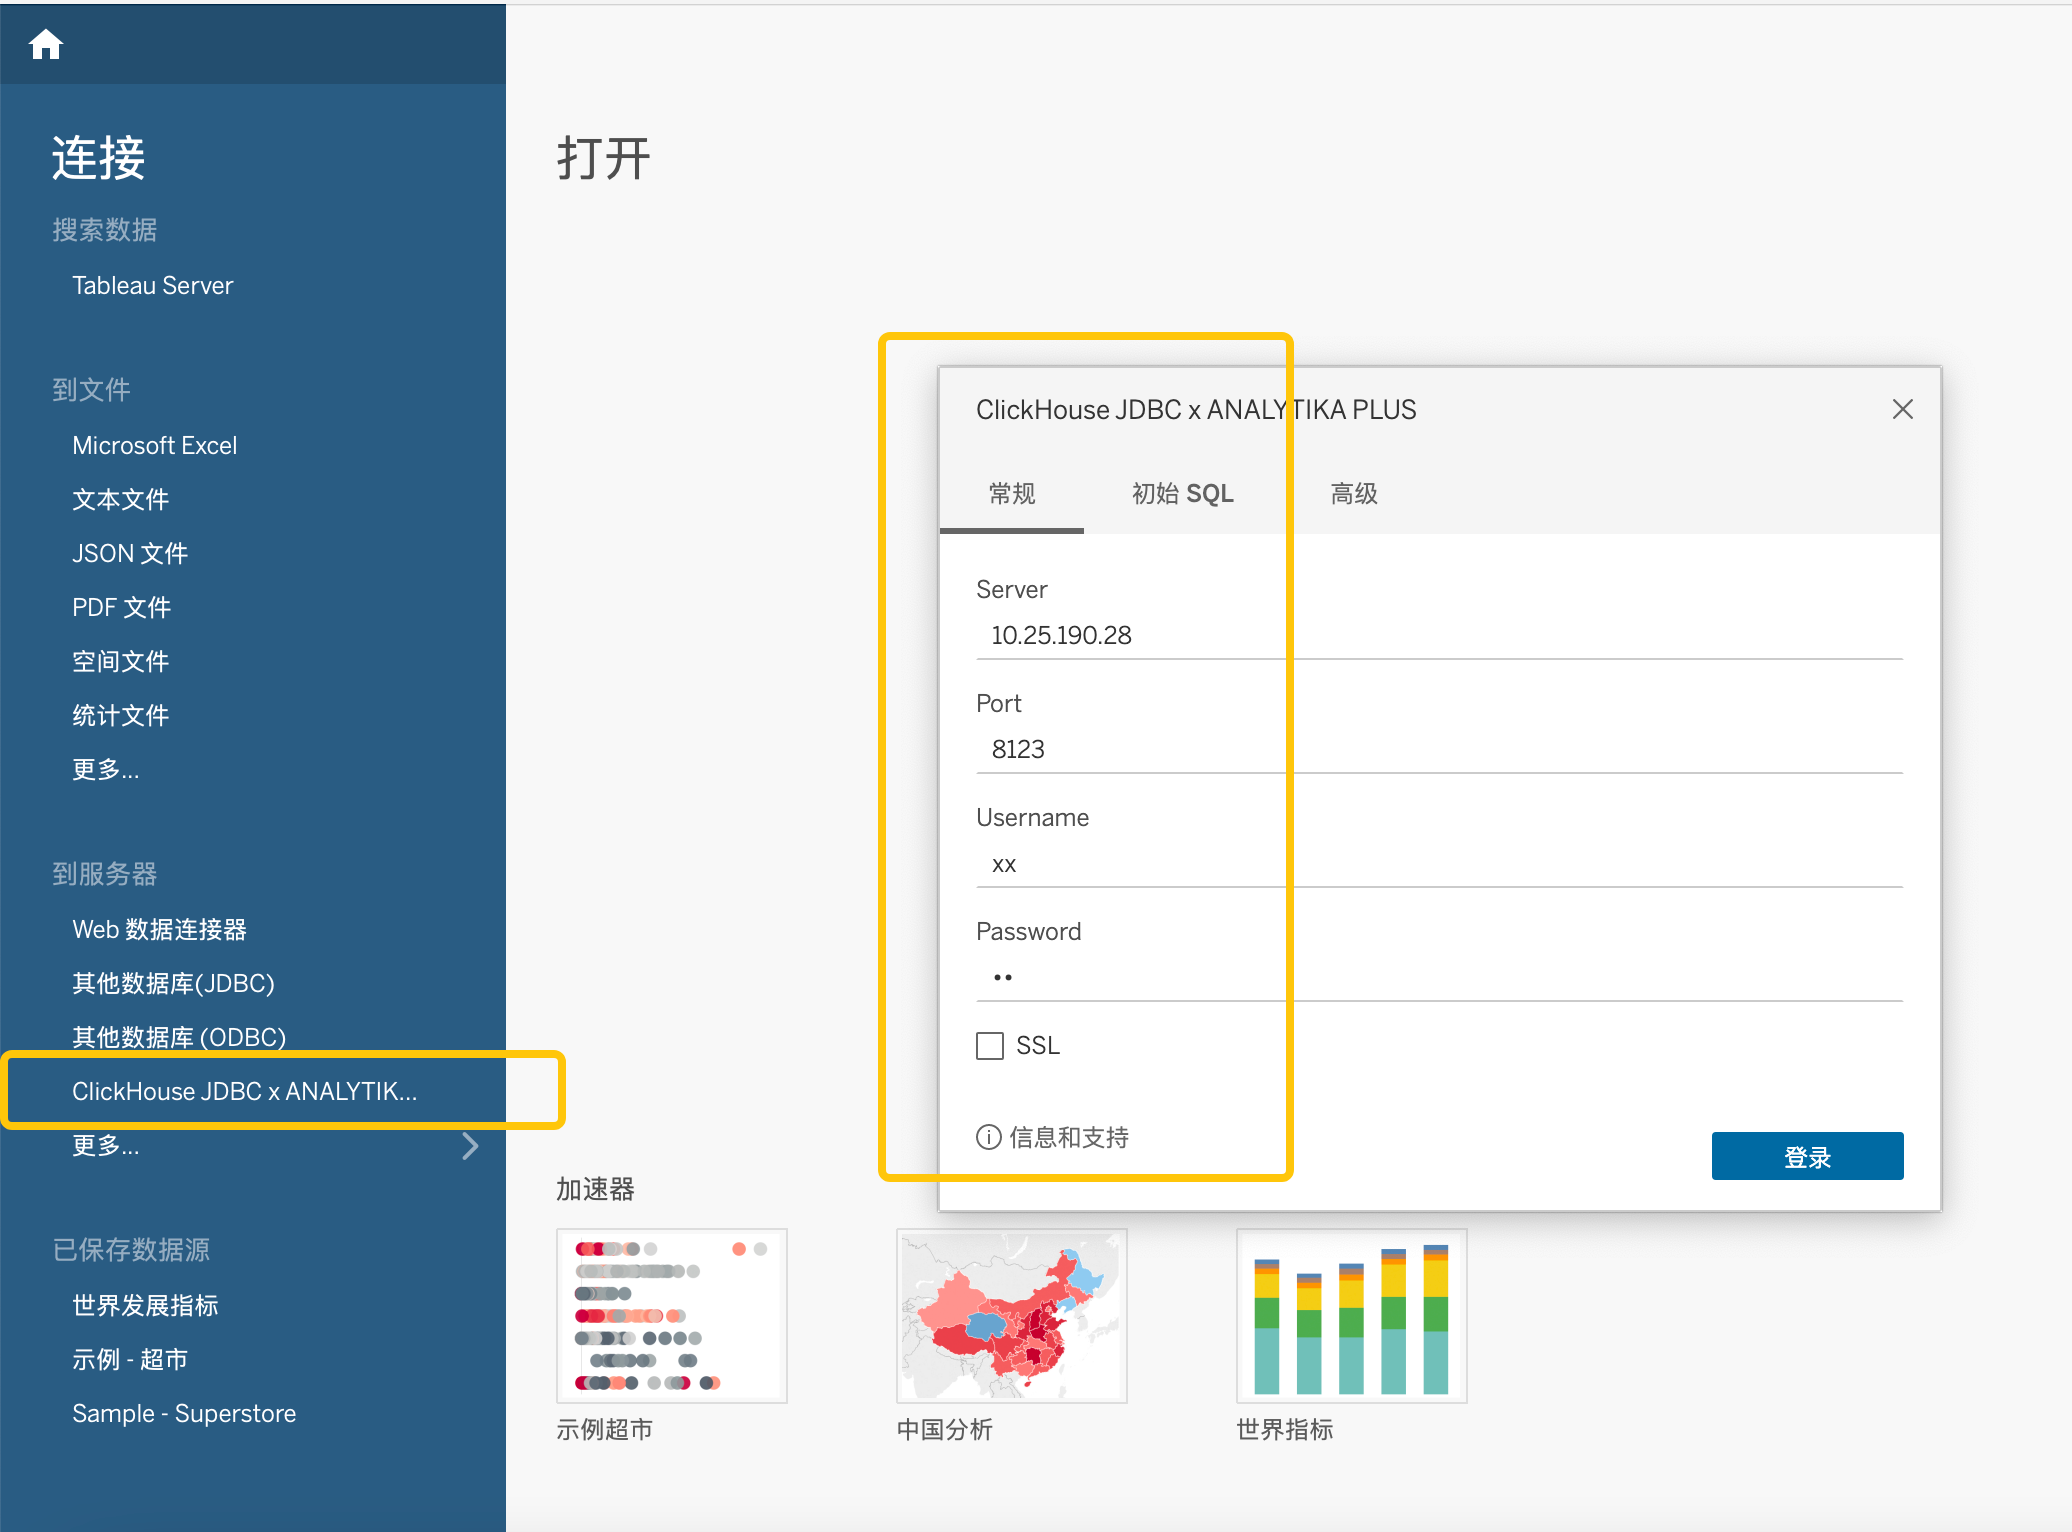
Tableau
The connection method is the same as connecting to an open-source ClickHouse. Refer to:
Connection method: https://clickhouse.com/docs/en/connect-a-ui/tableau-and-clickhouse/
Tableau installation method: https://www.tableau.com/products/desktop/download
Others
Since Byconity is fully compatible with open-source ClickHouse drivers (go/java/python), you can refer to the methods for connecting to ClickHouse when using other open-source visualization tools to connect to Byconity.