Query Optimizer
The optimizer is the core of the database system. An excellent optimizer can greatly improve query performance, especially in complex query scenarios. The optimizer can bring performance improvements of several to hundreds of times.
ByConity's optimizer provides extreme optimization capabilities based on four major optimization directions:
- RBO: rule-based optimization capability. Support column pruning, partition pruning, expression simplification, subquery disassociation, predicate pushdown, redundant operator elimination, Outer-JOIN to INNER-JOIN, operator pushdown storage, distributed operator splitting, etc. Heuristic optimization capability.
- CBO: Cost-based optimization capability. Support Join Reorder, Outer-Join Reorder, Join/Agg Reorder, CTE, materialized view, Dynamic Filter pushdown, Magic Set and other cost-based optimization capabilities. And it integrates Property Enforcement for distributed planning.
- DBO: optimization capability based on data dependencies. Support unique key, functional dependency, Order dependency, Inclusion dependency and other optimization capabilities based on data dependencies.
Turn on Query Optimizer
set dialect_type ='ANSI' or set enable_optimizer =1
If turn on ANSI mode, the optimizer will be turned on automatically.
Commands for collecting, displaying and deleting statistical information
Syntax Definition
- Subsequent versions will have automatic collection, update and analysis of statistical information
-- NOTE: ALL means currentDatabase().*

--    specifying columns and sample config is supportted
CREATE STATS [IF NOT EXISTS] (<db>.* | ALL | [<db>.]<table>['(' <col1>, <col2>, ..., <coln> ')']) [WITH (FULLSCAN | SAMPLE [<rows> ROWS] [<ratio> RATIO])]

-- Delete statistics
--   specifying columns is supported
DROP STATS (<db>.* | ALL | [<db>.]<table>['(' <col1>, <col2>, ..., <coln> ')' ])

--   specifying columns is supported
SHOW (STATS|COLUMN_STATS) (<db>.* | ALL | [<db>.]<table>'('<col1>, <col2>, ..., <coln> ')' )
Syntax Example:
Create Statistics
-- create stats for all table in current database which has no statistics
create stats if not exists all;
-- create stats for all table in db1 which has no statistics
create stats if not exists db1.*;

-- create stats for t1.c1,
create stats t1(c1);
-- create stats for t1.c1, t1.c2,
create stats t1(c1, c2);

-- create stats on t1, force to use fullscan,
-- otherwise controlled by statistics_enable_sample
create stats t1 with fullscan
-- sample MAX(**statistics_sample_row_count**, 0.01 * full_rows_count) rows when create stats for each table
create stats all with 0.01 ratio;
-- sample MAX(40000000, 0.01 * full_rows_count) rows when create stats for each table
create stats all with 0.01 ratio 40000000 rows;
-- sample with default settings,
-- controlled by **statistics_sample_row_count** and **statistics_sample_ratio
create stats all with sample;
Show Statistics
-- show table statistics for all tables in current database
show stats all;
-- show table statistics for all tables in db1
show stats db1.*;
-- show table statistics for table t1
show stats t1;
-- show column statistics for table t1
show column_stats t1;

-- show column statistics for column c1, c2 of table t1
show column_stats t1(c1, c2);
Drop Statistics
-- show statistics for all tables in current database
drop stats all;
-- show statistics for all tables in db1.*
drop stats db1.*;
-- show statistics for table t1
drop stats t1;


-- drop statistics for column c1, c2 of table t1
drop stats t1(c1, c2);
Usage of Explain
Explain
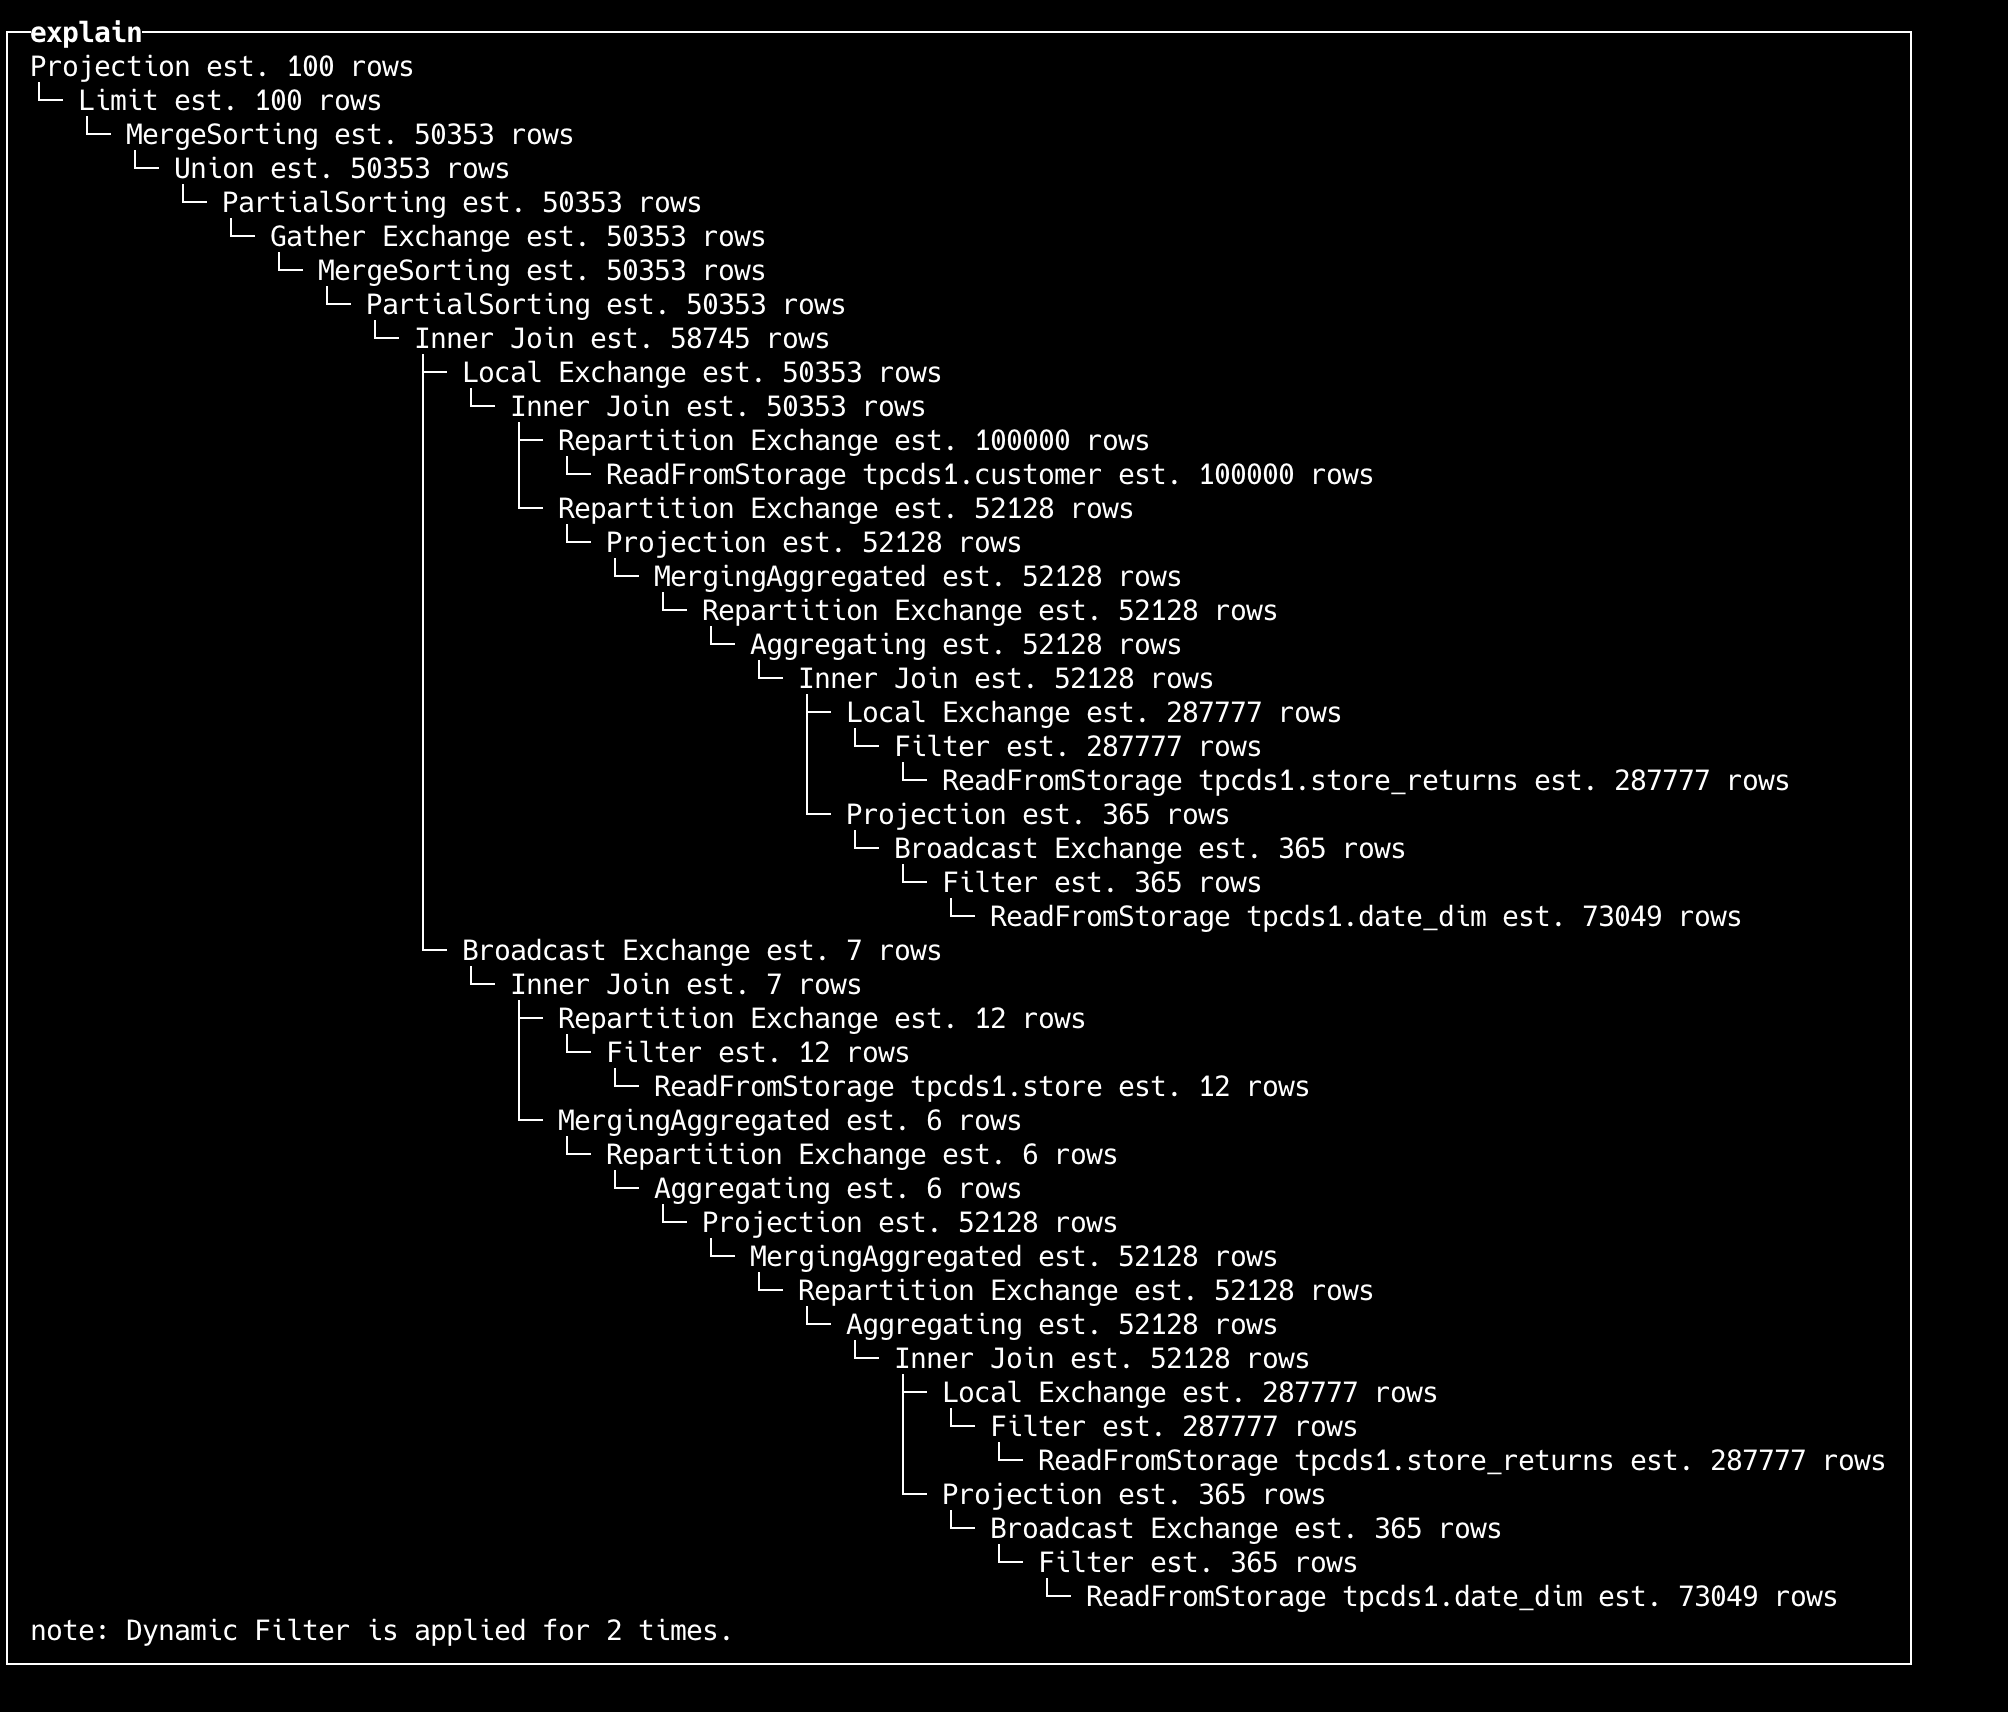
- Explain + SQL
EXPLAIN
WITH
    (
        SELECT
            sr_customer_sk AS ctr_customer_sk,
            sr_store_sk AS ctr_store_sk,
            sum(sr_return_amt) AS ctr_total_return
        FROM store_returns
        , date_dim
        WHERE (sr_returned_date_sk = d_date_sk) AND (d_year = 2000)
        GROUP BY
            sr_customer_sk,
            sr_store_sk
    ) AS customer_total_return
SELECT c_customer_id
FROM customer_total_return AS ctr1
, store
, customer
WHERE (ctr1.ctr_total_return >
(
    SELECT avg(ctr_total_return) * 1.2
    FROM customer_total_return AS ctr2
    WHERE ctr1.ctr_store_sk = ctr2.ctr_store_sk
)) AND (s_store_sk = ctr1.ctr_store_sk) AND (s_state = 'TN') AND (ctr1.ctr_customer_sk = c_customer_sk)
ORDER BY c_customer_id ASC
LIMIT 100
- Result of Explain
Explain Analyze
Explain analyze + SQL
EXPLAIN ANALYZE LOGICAL
WITH customer_total_return AS

    (
        SELECT
            sr_customer_sk AS ctr_customer_sk,
            sr_store_sk AS ctr_store_sk,
            sum(sr_return_amt) AS ctr_total_return
        FROM store_returns
        , date_dim
        WHERE (sr_returned_date_sk = d_date_sk) AND (d_year = 2000)
        GROUP BY
            sr_customer_sk,
            sr_store_sk
    )
SELECT c_customer_id
FROM customer_total_return AS ctr1
, store
, customer
WHERE (ctr1.ctr_total_return >
(
    SELECT avg(ctr_total_return) * 1.2
    FROM customer_total_return AS ctr2
    WHERE ctr1.ctr_store_sk = ctr2.ctr_store_sk
)) AND (s_store_sk = ctr1.ctr_store_sk) AND (s_state = 'TN') AND (ctr1.ctr_customer_sk = c_customer_sk)
ORDER BY c_customer_id ASC
LIMIT 100
┌─Explain Analyze──────────────────────────────────────────────────────────────────────────────────────────────────────────────────────────────────────────────────────┐
│ Limit │
│ │ Est. 100 rows, cost 8.2e+05 │
│ │ Act. 100 rows (2.4 KB), Throughput: 545.0K rows/s, CPU Time per worker: avg 2.0 us, max 2.0 us, Wall Time: 1.8 ms │
│ │ Filtered: 0.0%, QError: 1.0 │
│ └─ MergeSorting │
│ │ Est. 49.2K rows, cost 8.2e+05 │
│ │ Act. 100 rows (2.4 KB), Throughput: 545.0K rows/s, CPU Time per worker: avg 2.0 us, max 2.0 us, Wall Time: 1.8 ms │
│ │ Filtered: 96.9%, QError: 504.1 │
│ └─ Union │
│ │ Est. 49.2K rows, cost 8.2e+05 │
│ │ Act. 3.1K rows (78.1 KB), Throughput: 17.0M rows/s, CPU Time per worker: avg 0.0 us, max 0.0 us, Wall Time: 1.8 ms │
│ │ Filtered: 0.0%, QError: 15.8 │
│ └─ PartialSorting │
│ │ Est. 49.2K rows, cost 8.2e+05 │
│ │ Act. 3.1K rows (78.1 KB), Throughput: 17.0M rows/s, CPU Time per worker: avg 40.0 us, max 40.0 us, Wall Time: 1.8 ms │
│ │ Filtered: 0.0%, QError: 15.8 │
│ └─ Gather Exchange │
│ │ Est. 49.2K rows, cost 8.2e+05 │
│ └─ MergeSorting │
│ │ Est. 49.2K rows, cost 8.1e+05 │
│ │ Act. 12.5K rows (313.1 KB), Throughput: 108.2M rows/s, CPU Time per worker: avg 23.0 us, max 25.0 us, Wall Time: 1.2 ms │
│ │ Filtered: -1.6%, QError: 3.9 │
│ └─ PartialSorting │
│ │ Est. 49.2K rows, cost 8.1e+05 │
│ │ Act. 12.3K rows (308.3 KB), Throughput: 91.6M rows/s, CPU Time per worker: avg 40.0 us, max 40.0 us, Wall Time: 1.3 ms │
│ │ Filtered: 0.0%, QError: 4.0 │
│ └─ Inner Join │
│ │ Est. 47.5K rows, cost 8.1e+05 │
│ │ Act. 12.3K rows (308.3 KB), Throughput: 91.6M rows/s, CPU Time per worker: avg 41.6 ms, max 41.8 ms, Wall Time: 1.3 ms │
│ │ Filtered: 0.0%, QError: 3.9 │
│ │ Condition: sr_store_sk_1 == s_store_sk │
│ │ Filter: `sum(sr_return_amt)_1` > (`avg(ctr_total_return)` * 1.2) │
│ ├─ Local Exchange │
│ │ │ Est. 49.2K rows, cost 2.9e+05 │
│ │ └─ Inner Join │
│ │ │ Est. 49.2K rows, cost 2.9e+05 │
│ │ │ Act. 49.3K rows (2.1 MB), Throughput: 542.3M rows/s, CPU Time per worker: avg 6.2 ms, max 6.4 ms, Wall Time: 896.0 us │
│ │ │ Filtered: 0.0%, QError: 1.0 │
│ │ │ Condition: c_customer_sk == sr_customer_sk_1 │
│ │ ├─ Repartition Exchange │
│ │ │ │ Est. 97.7K rows, cost 9.0e+04 │
│ │ │ │ Partition by: {c_customer_sk} │
│ │ │ └─ ReadFromStorage tpcds.customer │
│ │ │ Est. 97.7K rows, cost 7.4e+04 │
│ │ │ Act. 97.7K rows (3.1 MB), Throughput: 22.2G rows/s, CPU Time per worker: avg 362.0 us, max 402.0 us, Wall Time: 47.0 us │
│ │ │ Filtered: 0.0%, QError: 1.0 │
│ │ └─ Repartition Exchange │
│ │ │ Est. 50.9K rows, cost 6.1e+04 │
│ │ │ Partition by: {sr_customer_sk_1} │
│ │ └─ CTERef [0] │
│ │ Est. 50.9K rows, cost 5.2e+04 │
│ └─ Broadcast Exchange │
│ │ Est. 7 rows, cost 5.6e+04 │
│ └─ Inner Join │
│ │ Est. 7 rows, cost 5.6e+04 │
│ │ Act. 6 rows (102.0 Bytes), Throughput: 67.7K rows/s, CPU Time per worker: avg 280.0 us, max 360.0 us, Wall Time: 870.0 us │
│ │ Filtered: 97.9%, QError: 1.2 │
│ │ Condition: s_store_sk == sr_store_sk_2 │
│ ├─ Repartition Exchange │
│ │ │ Est. 12 rows, cost 1.2e+01 │
│ │ │ Partition by: {s_store_sk} │
│ │ └─ Filter │
│ │ │ Est. 12 rows, cost 9.8e+00 │
│ │ │ Act. 12 rows (240.0 Bytes), Throughput: 28.6M rows/s, CPU Time per worker: avg 16.0 us, max 24.0 us, Wall Time: 5.0 us │
│ │ │ Filtered: 0.0%, QError: 1.0 │
│ │ │ s_state = 'TN' │
│ │ └─ ReadFromStorage tpcds.store │
│ │ Est. 12 rows, cost 8.9e+00 │
│ │ Act. 12 rows (240.0 Bytes), Throughput: 28.6M rows/s, CPU Time per worker: avg 48.0 us, max 72.0 us, Wall Time: 4.0 us │
│ │ Filtered: 0.0%, QError: 1.0 │
│ └─ MergingAggregated │
│ │ Est. 6 rows, cost 5.6e+04 │
│ │ Act. 280 rows (4.9 KB), Throughput: 3.1M rows/s, CPU Time per worker: avg 60.0 us, max 80.0 us, Wall Time: 867.0 us │
│ │ Filtered: 0.0%, QError: 46.7 │
│ └─ Repartition Exchange │
│ │ Est. 6 rows, cost 5.6e+04 │
│ │ Partition by: {sr_store_sk_2} │
│ └─ Aggregating │
│ │ Est. 6 rows, cost 5.6e+04 │
│ │ Act. 14 rows (238.0 Bytes), Throughput: 145.6K rows/s, CPU Time per worker: avg 7.0 us, max 9.0 us, Wall Time: 955.0 us │
│ │ Filtered: 100.0%, QError: 2.3 │
│ │ Group by: {sr_store_sk_2} │
│ └─ Projection │
│ │ Est. 50.9K rows, cost 5.6e+04 │
│ │ Act. 49.3K rows (887.4 KB), Throughput: 519.5M rows/s, CPU Time per worker: avg 0.0 us, max 0.0 us, Wall Time: 947.0 us │
│ │ Filtered: 0.0%, QError: 1.0 │
│ └─ CTERef [0] │
│ Est. 50.9K rows, cost 5.2e+04 │
│ CTEDef [0] │
│ MergingAggregated │
│ │ Est. 50.9K rows, cost 4.3e+05 │
│ │ Act. 49.3K rows (1.3 MB), Throughput: 497.5M rows/s, CPU Time per worker: avg 34.0 us, max 35.0 us, Wall Time: 996.0 us │
│ │ Filtered: 0.0%, QError: 1.0 │
│ └─ Repartition Exchange │
│ │ Est. 50.9K rows, cost 4.3e+05 │
│ │ Partition by: {sr_customer_sk, sr_store_sk} │
│ └─ Aggregating │
│ │ Est. 50.9K rows, cost 4.2e+05 │
│ │ Act. 51.4K rows (1.3 MB), Throughput: 1.1G rows/s, CPU Time per worker: avg 27.0 us, max 28.0 us, Wall Time: 506.0 us │
│ │ Filtered: 5.8%, QError: 1.0 │
│ │ Group by: {sr_customer_sk, sr_store_sk} │
│ └─ Inner Join │
│ │ Est. 50.9K rows, cost 4.2e+05 │
│ │ Act. 54.5K rows (1.4 MB), Throughput: 1.2G rows/s, CPU Time per worker: avg 14.3 ms, max 15.0 ms, Wall Time: 477.0 us │
│ │ Filtered: -90.6%, QError: 1.1 │
│ │ Condition: sr_returned_date_sk == d_date_sk │
│ ├─ Local Exchange │
│ │ │ Est. 280.8K rows, cost 2.3e+05 │
│ │ └─ Filter │
│ │ │ Est. 280.8K rows, cost 2.3e+05 │
│ │ │ Act. 54.5K rows (1.9 MB), Throughput: 5.7G rows/s, CPU Time per worker: avg 865.0 us, max 885.0 us, Wall Time: 96.0 us │
│ │ │ Filtered: 0.0%, QError: 5.2 │
│ │ │ Dynamic Filters: {sr_returned_date_sk:range} │
│ │ └─ ReadFromStorage tpcds.store_returns │
│ │ Est. 280.8K rows, cost 2.1e+05 │
│ │ Act. 54.5K rows (1.9 MB), Throughput: 5.8G rows/s, CPU Time per worker: avg 2.4 ms, max 2.4 ms, Wall Time: 95.0 us │
│ │ Filtered: 0.0%, QError: 5.2 │
│ └─ Projection │
│ │ Est. 366 rows, cost 6.0e+04 │
│ │ Act. 28.6K rows (228.8 KB), Throughput: 45.4G rows/s, CPU Time per worker: avg 1.1 ms, max 1.3 ms, Wall Time: 7.0 us │
│ │ Filtered: 0.0%, QError: 80.0 │
│ │ Dynamic Filters Builder: {d_date_sk} │
│ └─ Broadcast Exchange │
│ │ Est. 366 rows, cost 6.0e+04 │
│ └─ Filter │
│ │ Est. 366 rows, cost 5.9e+04 │
│ │ Act. 366 rows (6.1 KB), Throughput: 85.1M rows/s, CPU Time per worker: avg 282.0 us, max 283.0 us, Wall Time: 44.0 us │
│ │ Filtered: 0.0%, QError: 1.0 │
│ │ d_year = 2000 │
│ └─ ReadFromStorage tpcds.date_dim │
│ Est. 71.3K rows, cost 5.4e+04 │
│ Act. 366 rows (6.1 KB), Throughput: 85.1M rows/s, CPU Time per worker: avg 780.0 us, max 840.0 us, Wall Time: 43.0 us │
│ Filtered: 0.0%, QError: 199.6 │
│ note: Dynamic Filter is applied for 1 times. │
│ note: CTE(Common Table Expression) is applied for 2 times. │
└──────────────────────────────────────────────────────────────────────────────────────────────────────────────────────────────────────────────────────────────────────┘
Explain analyze distributed + SQL
EXPLAIN ANALYZE DISTRIBUTED
SELECT
    i_item_id,
    avg(ss_quantity) AS agg1,
    avg(ss_list_price) AS agg2,
    avg(ss_coupon_amt) AS agg3,
    avg(ss_sales_price) AS agg4
FROM store_sales
, customer_demographics
, date_dim
, item
, promotion
WHERE (ss_sold_date_sk = d_date_sk) AND (ss_item_sk = i_item_sk) AND (ss_cdemo_sk = cd_demo_sk) AND (ss_promo_sk = p_promo_sk) AND (cd_gender = 'M') AND (cd_marital_status = 'S') AND (cd_education_status = 'College') AND ((p_channel_email
 = 'N') OR (p_channel_event = 'N')) AND (d_year = 2000)
GROUP BY i_item_id
ORDER BY i_item_id ASC
LIMIT 100
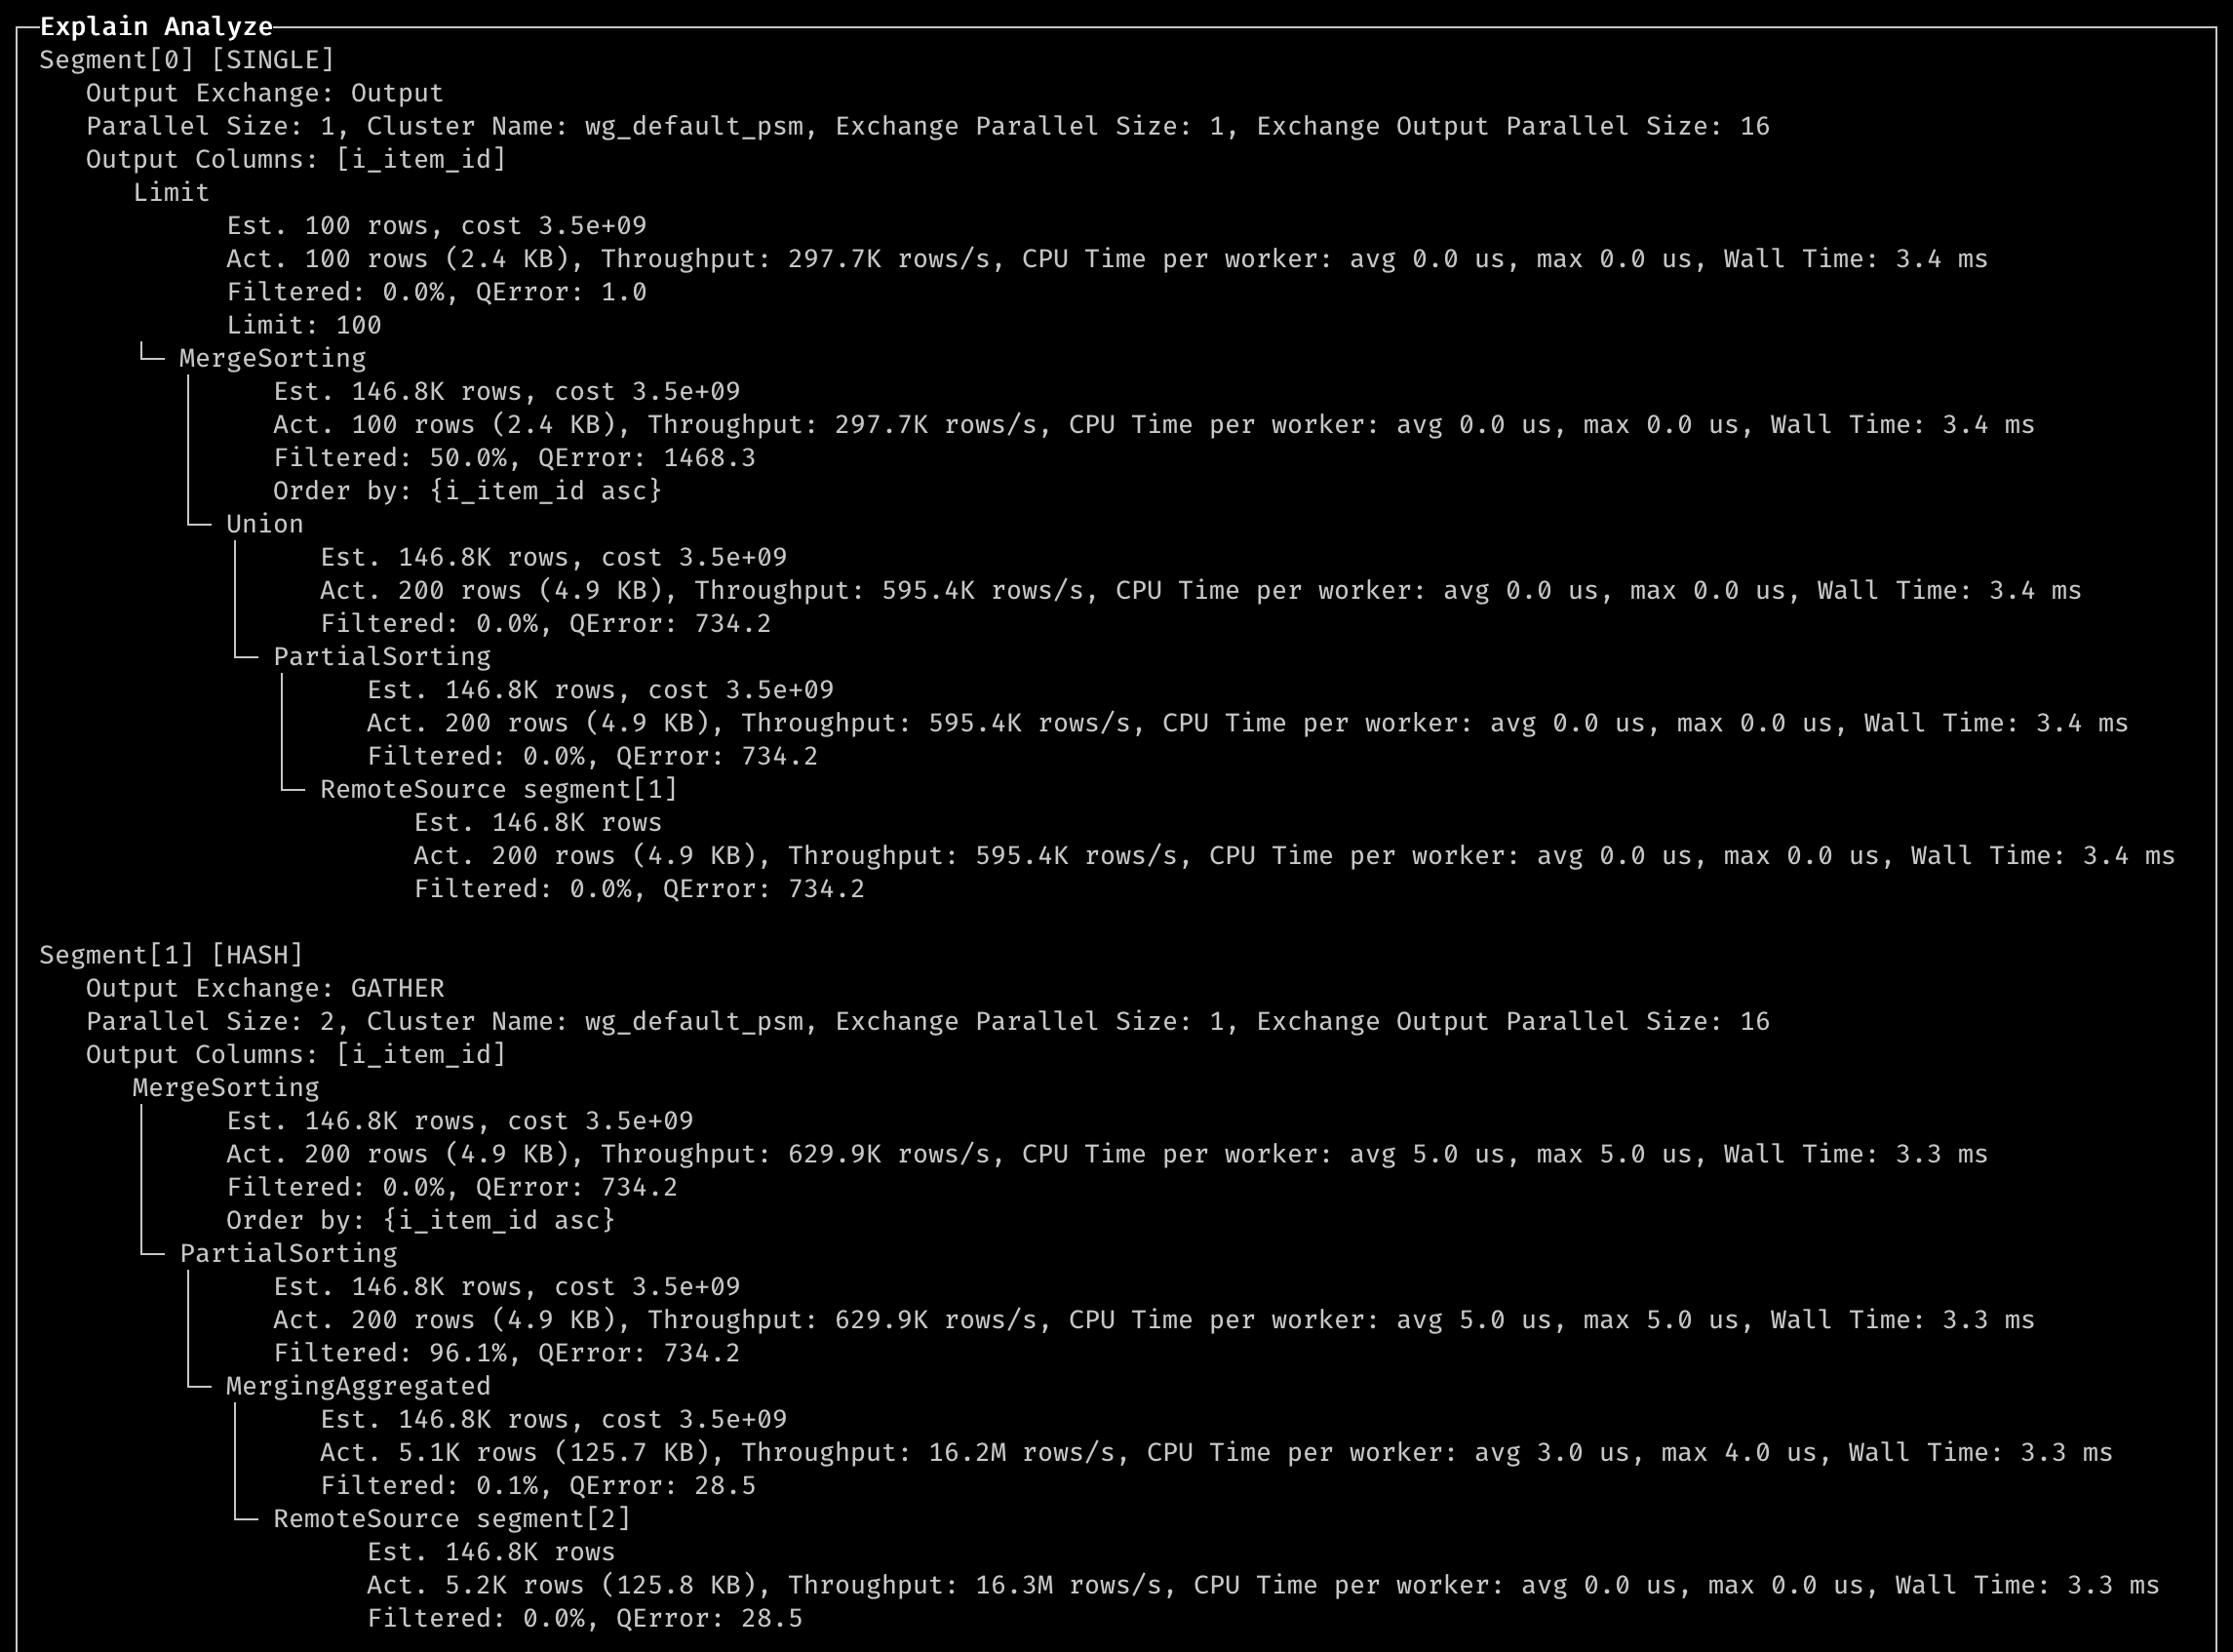
- QError: max(Est rows, Act rows) / min(Est rows, Act rows), 1 is the best.
- Wall Time: max wall time of all the workers. We can figure out which step takes the most time.
- CPU Time: We can figure out which step has the data skew issue. (If the max time is bigger than avg time, there is one worker which processed too much data.)